So a few months ago I wrote a basic workflow for IR analysts to be able to look for traces of known malware in RAM memory dumps using Volatility. That post received an overwhelming positive response, so I decided to take it even further. This past week I presented a workshop based on that first write up at the 2019 Converge conference in Detroit.
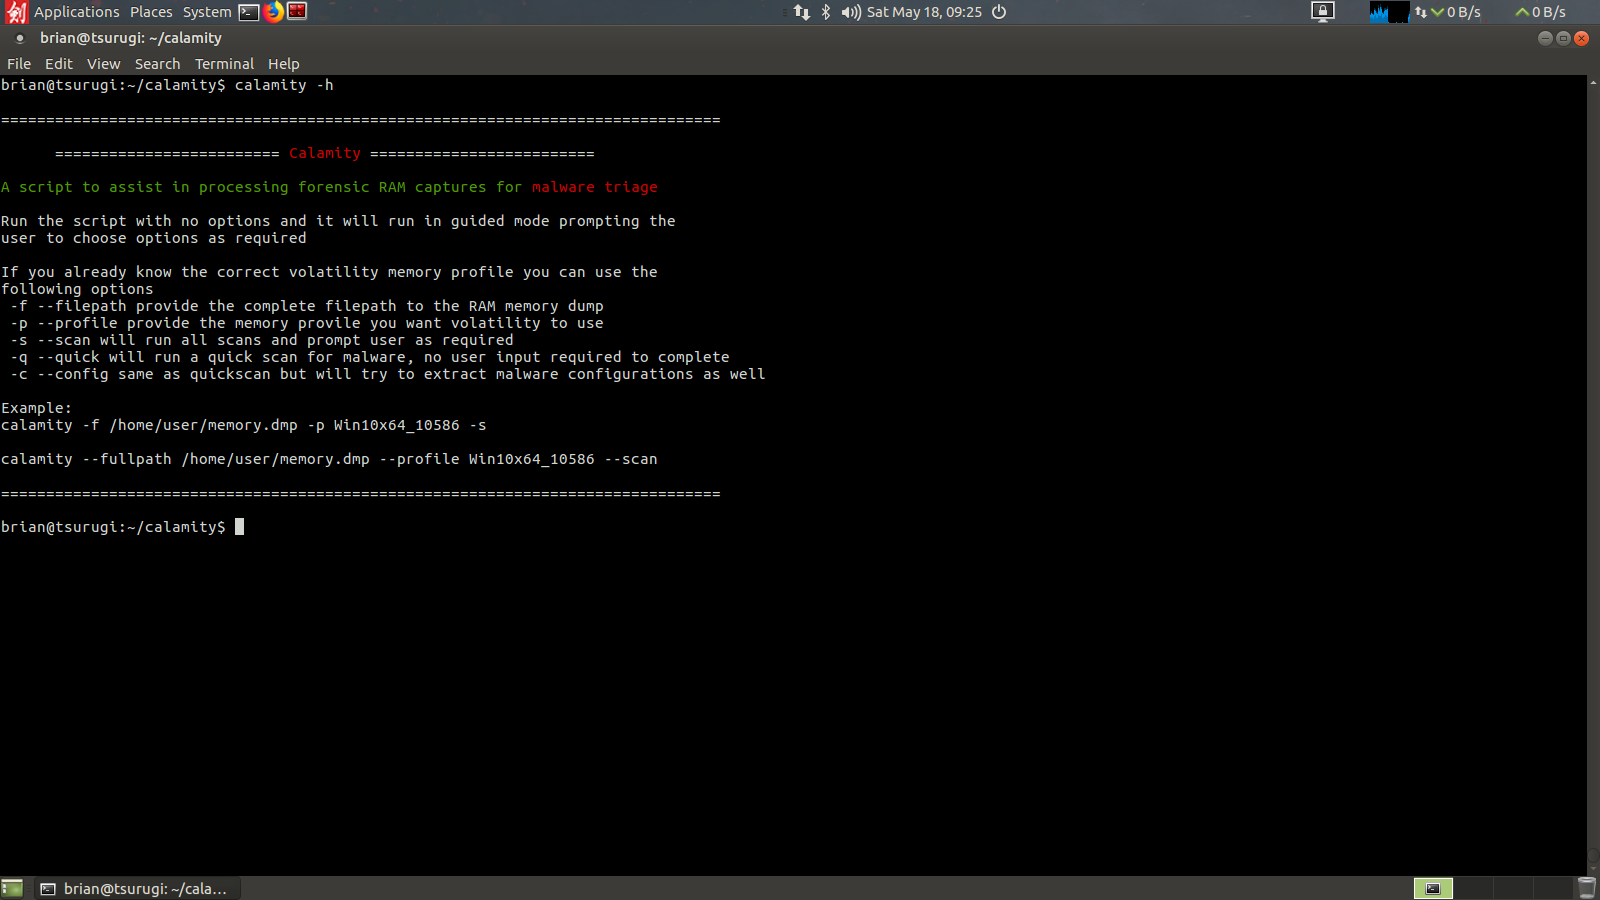
For that workshop I wanted to create a way to make the memory analysis process even easier, so I wrote a wrapper script for it in bash called Calamity. Calamity in its essence is taking the steps from my first process and making it even easier, both from a learning perspective and from an automation perspective. It can be run with flags to automate the analysis, or for a Jr analyst they can invoke the script with no flags and it will ask questions to lead the analyst through the process. You can find Calamity on my Github page.
Since the script is written in bash, you will need to be running in a Linux system to install (I’ve not tested it for OSX or WSL yet). To begin clone the repository from github:
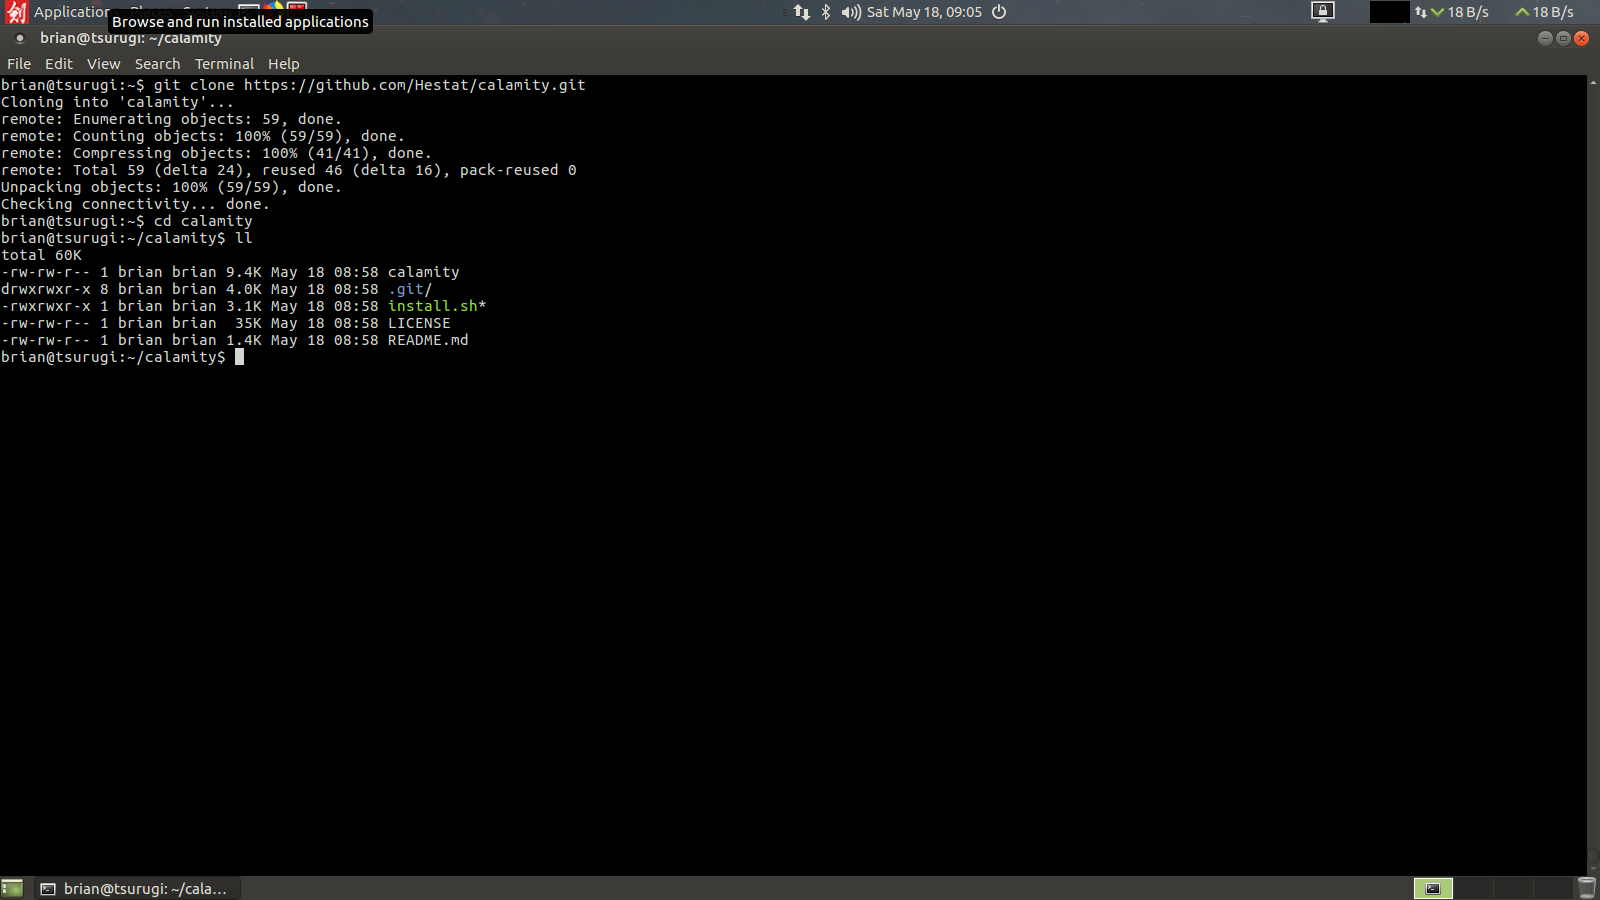
git clone https://github.com/Hestat/calamity.git
cd calamity
sudo ./install.sh
then go into the Calamity directory and run the intsall.sh script with sudo rights. This should grab the latest version of Volatility, ClamAV, Loki IOC scanner, and JP cert MalconfScan plugin(there may be some bugs here getting all dependencies, will update as I can figure out the details). Once installed you should be able to call it like any other tool. If you want to update Calamity just rerun the install script and it will see it’s already installed and will instead check for updates and apply them.
First lets work through a guided analysis:
Here I’ll be using the 2nd example from my workshop. To begin the analyst just needs to know the full path to the memory image, or be in the current directory with the memory image. I’ll be showing this example by working in the same directory as the memory image. The first question for the analyst to answer is to provide the memory image, again full path if you are not in the current directory as the memory image (no tab complete here, *tip* copy the full path from a scratchpad). Once entered Calamity will run the volatility imageinfo command and present the analyst with possible memory profiles.

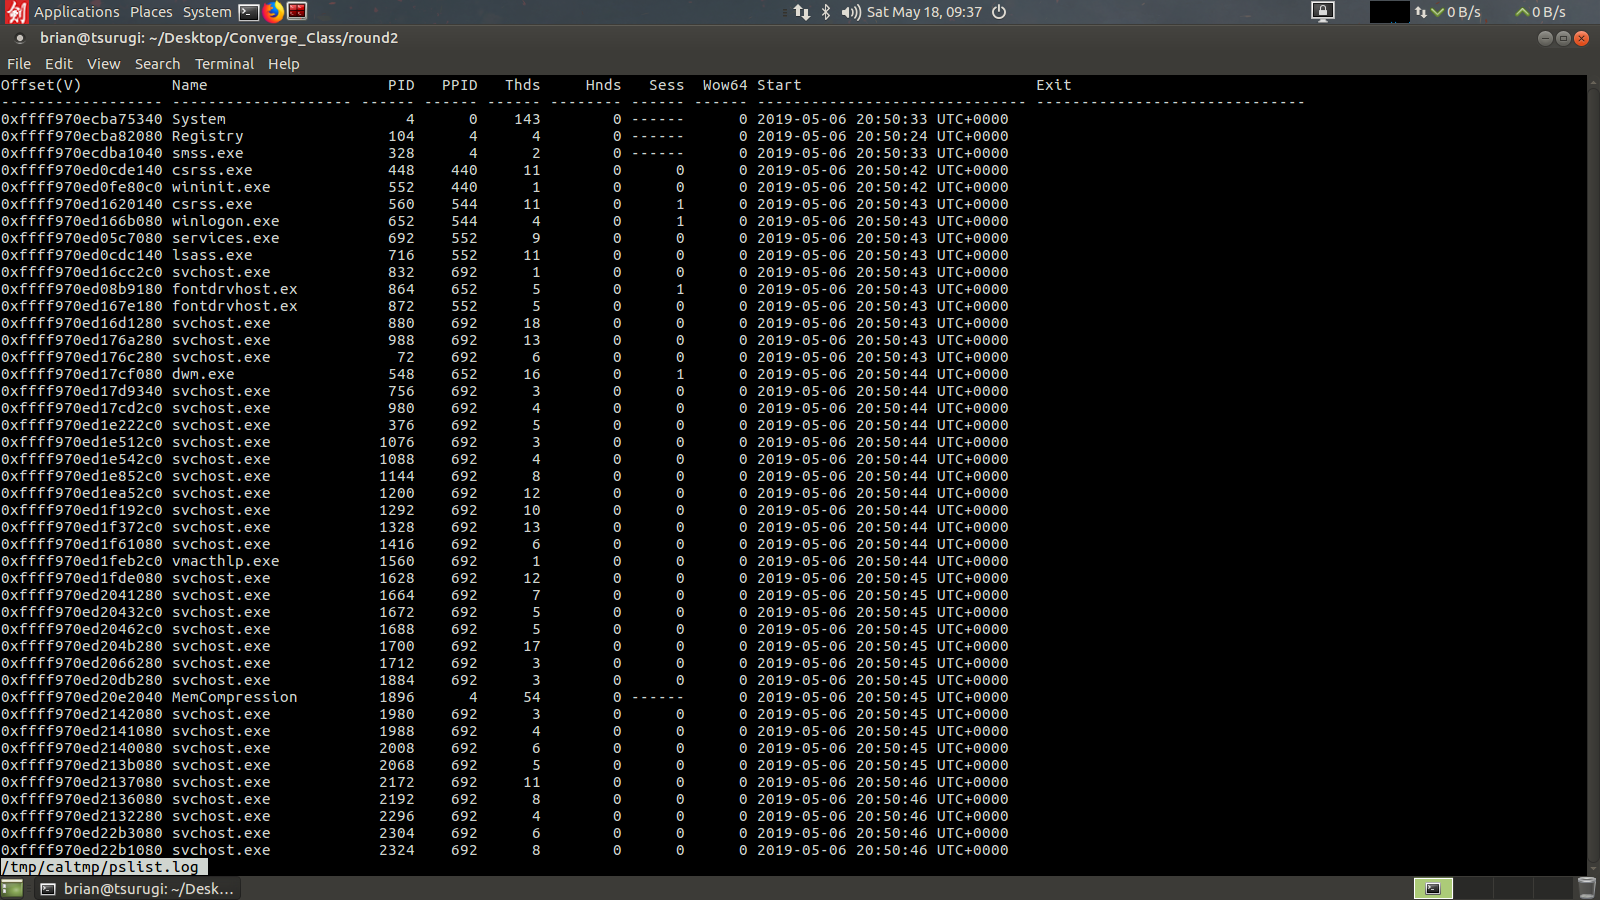
Once the analyst has entered a suggested profile the script will run both the pslist and netscan volatility commands to grab the running processes and network connections. It will then pause to have the analyst inspect the output to see if the correct profile was used.
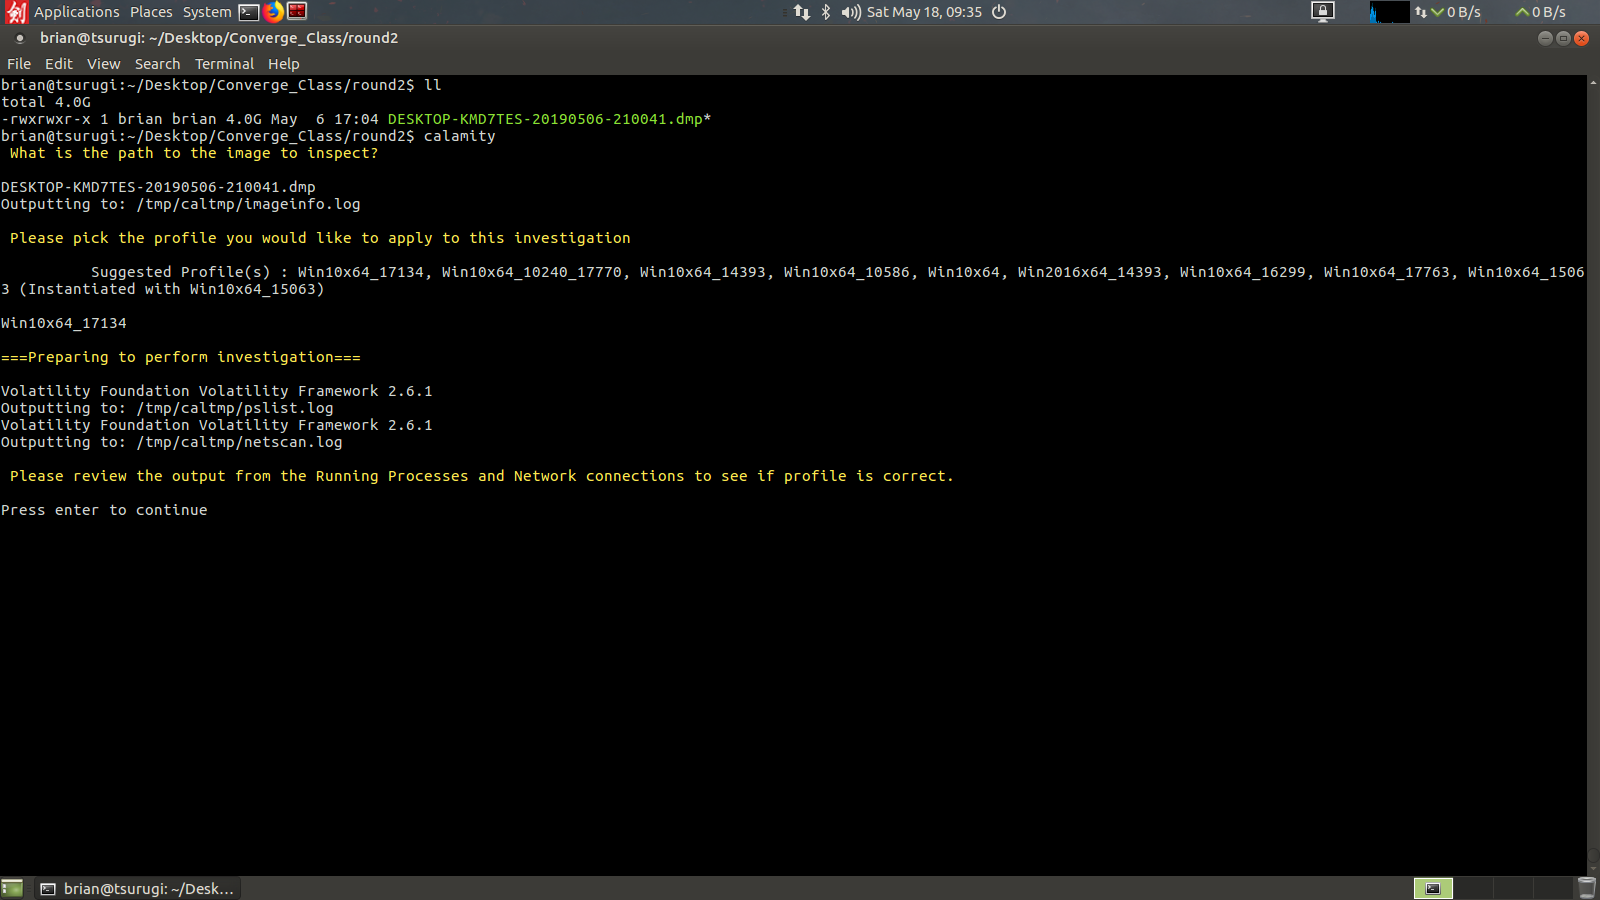
These are opened using the less unix utility, you can scroll in the windows and use the “q” key to close the output. If you can read all the process names and see little to no corrupt output visually you can proceed. However if the process names are cutoff or you only see strange unicode looking characters answer no and calamity will ask you to choose a new memory profile to try again.
After confirming a proper output with the analyst the script will ask for a case folder to be created. This will be placed in the users home directory.
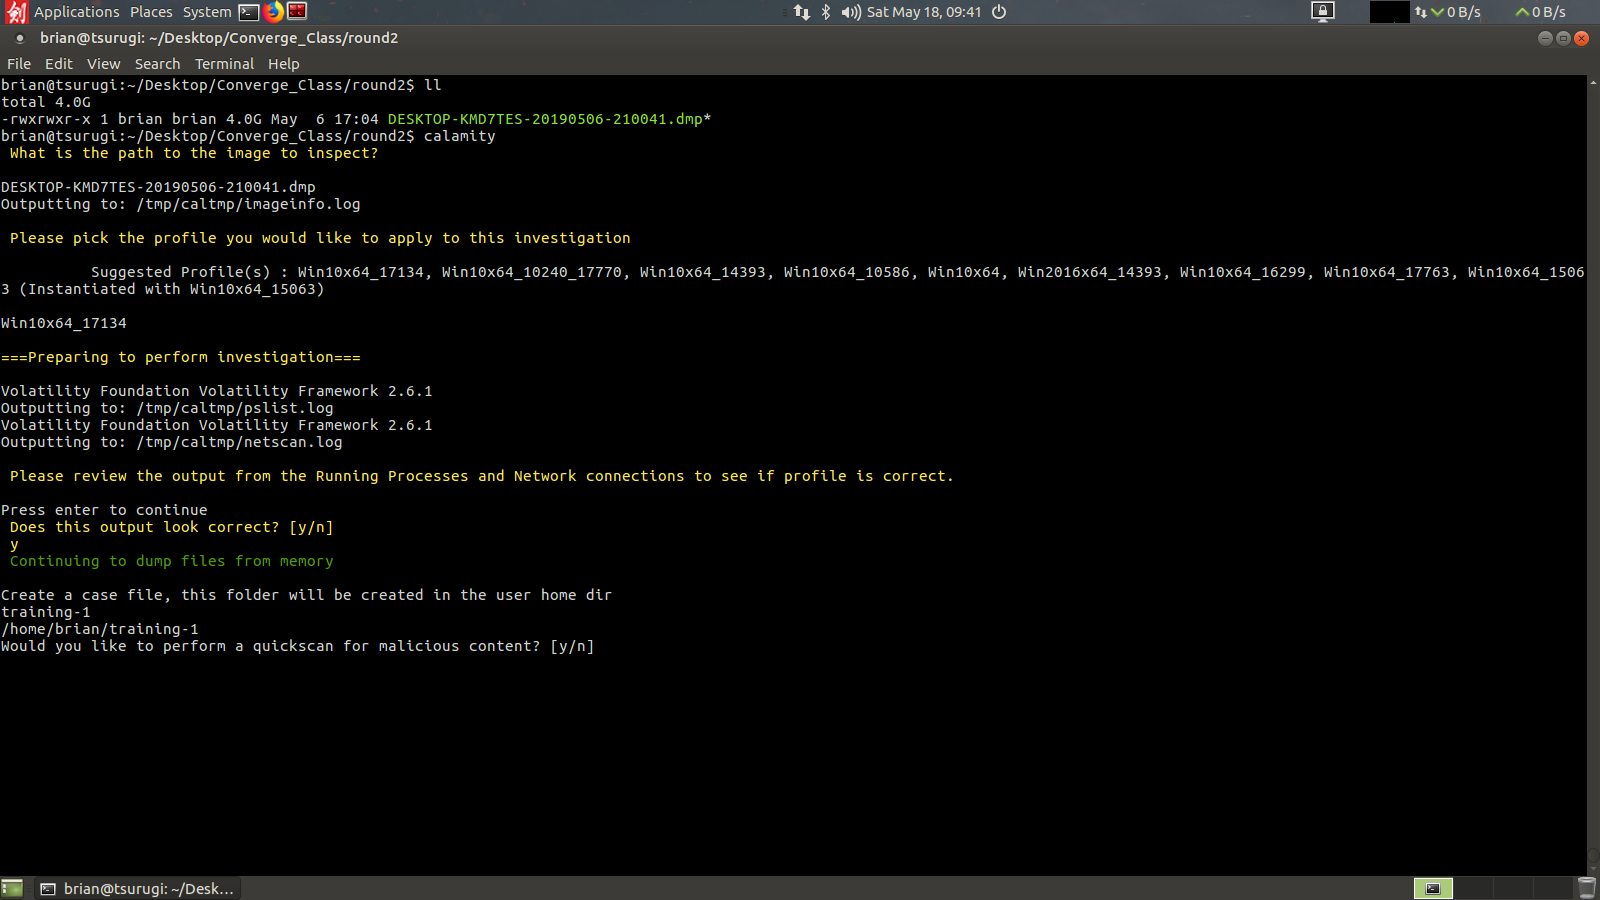
After creating the case folder the analyst will be asked if they want to run a quickscan. For 80% of investigations a quickscan will be the only check I would recommend. It will only be checking the dumped files using the malfind tool from volatility. If you opt not to run a quickscan it will ask if you want to perform a complete scan, this will dump all files using malfind, dlldump, and moddump. This will take a long time, potentially over 8 hours depending on the size of the RAM capture.
Here we will proceed with a quickscan. This will run Volatility with malfind and dump those files to disk to be scanned with ClamAV and Loki Scanner.
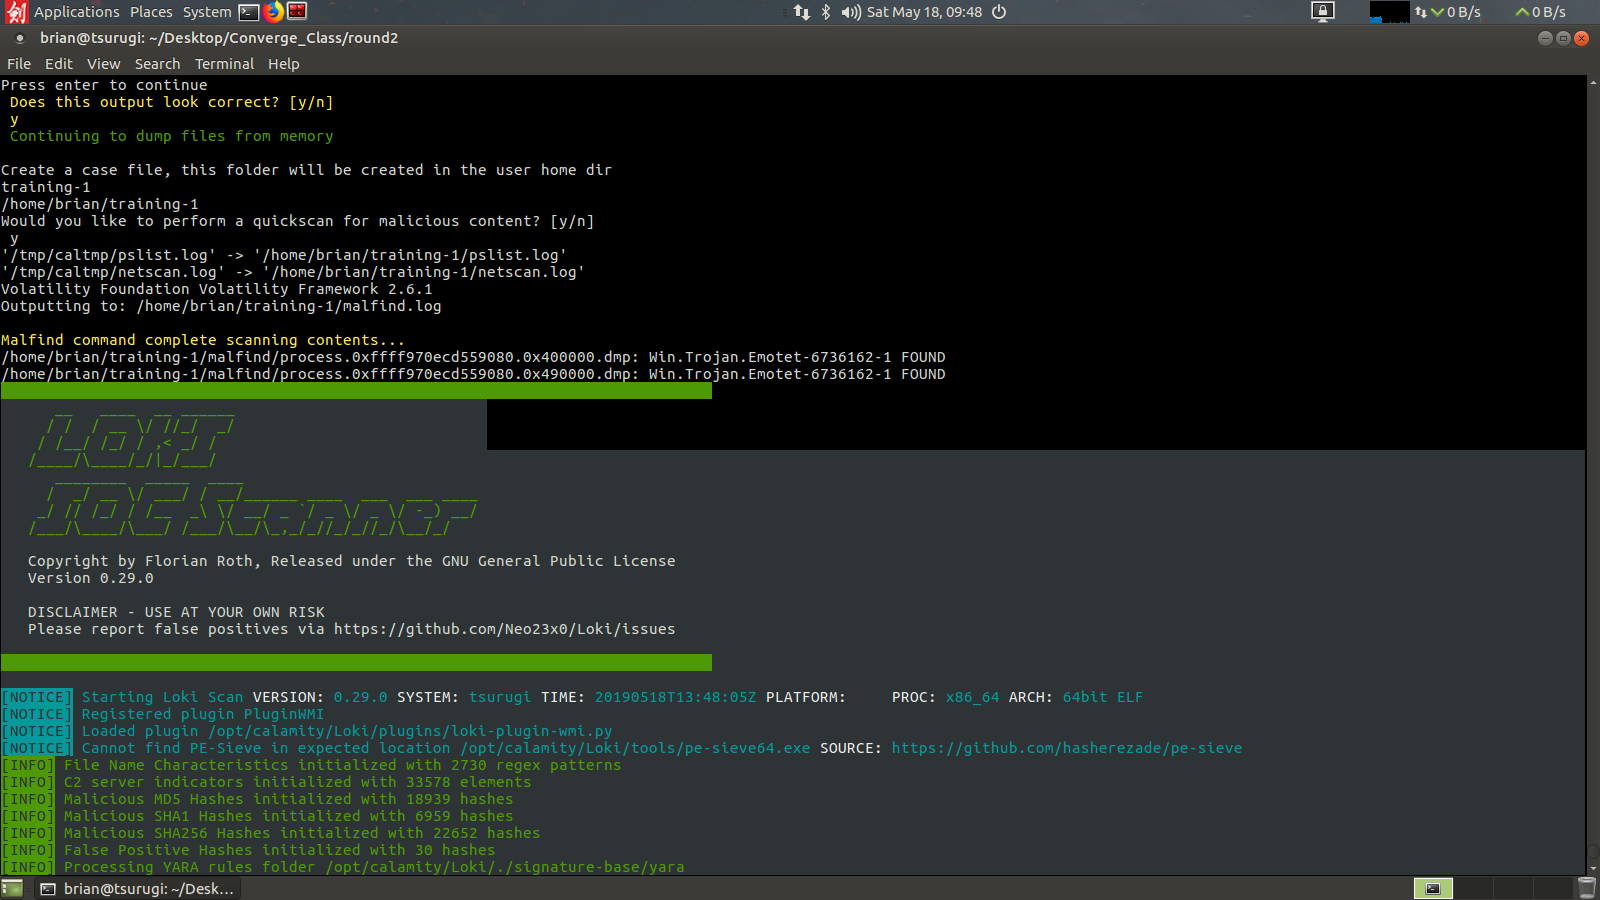
After completing the scans Calamity will also map the malware it finds back to the processes and network information previously recorded from the netscan and pslist outputs. Here we can see we found our memory sample was infected with a Emotet trojan running under process 8084, named couldprompt.exe and that it had UDP network traffic picked up as well.
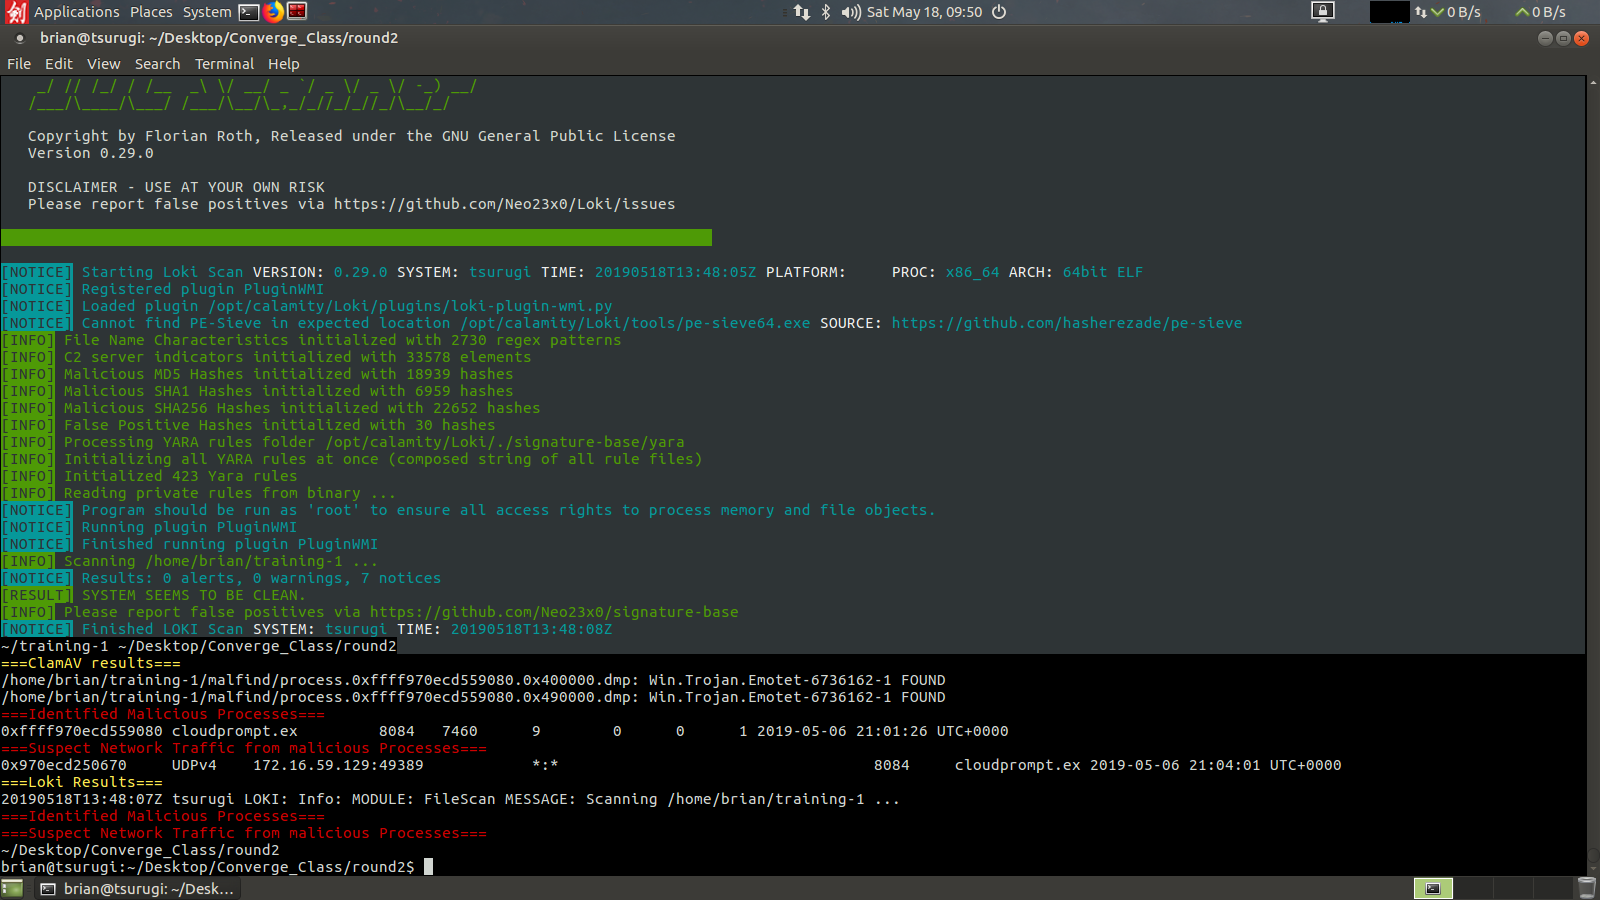
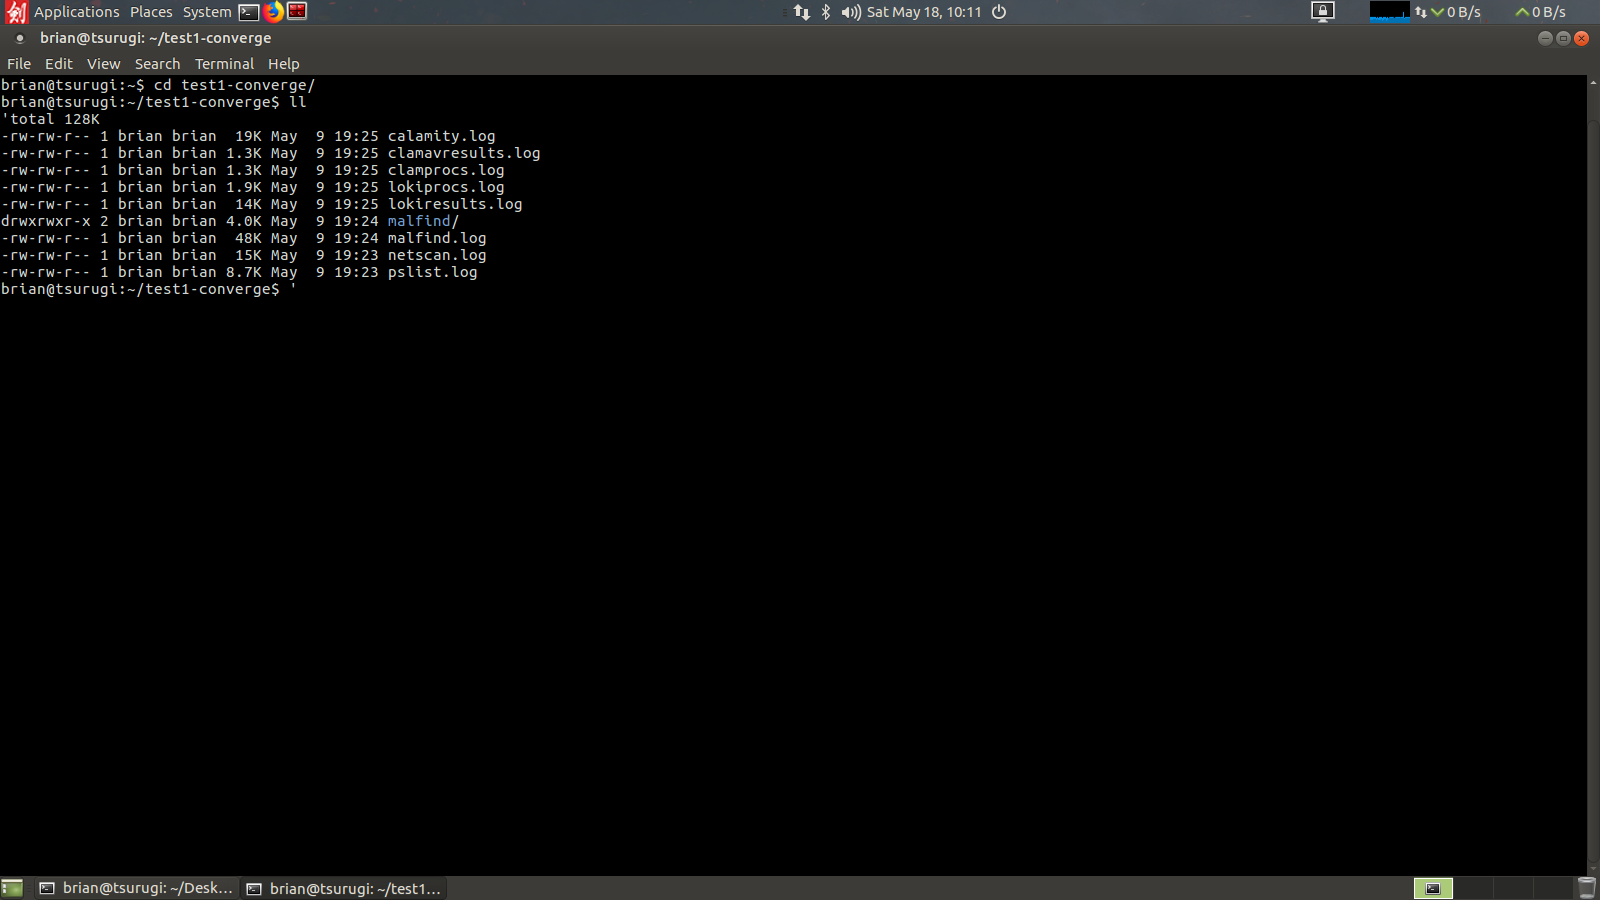
All of the steps are logged in the case folder created earlier by the analyst.
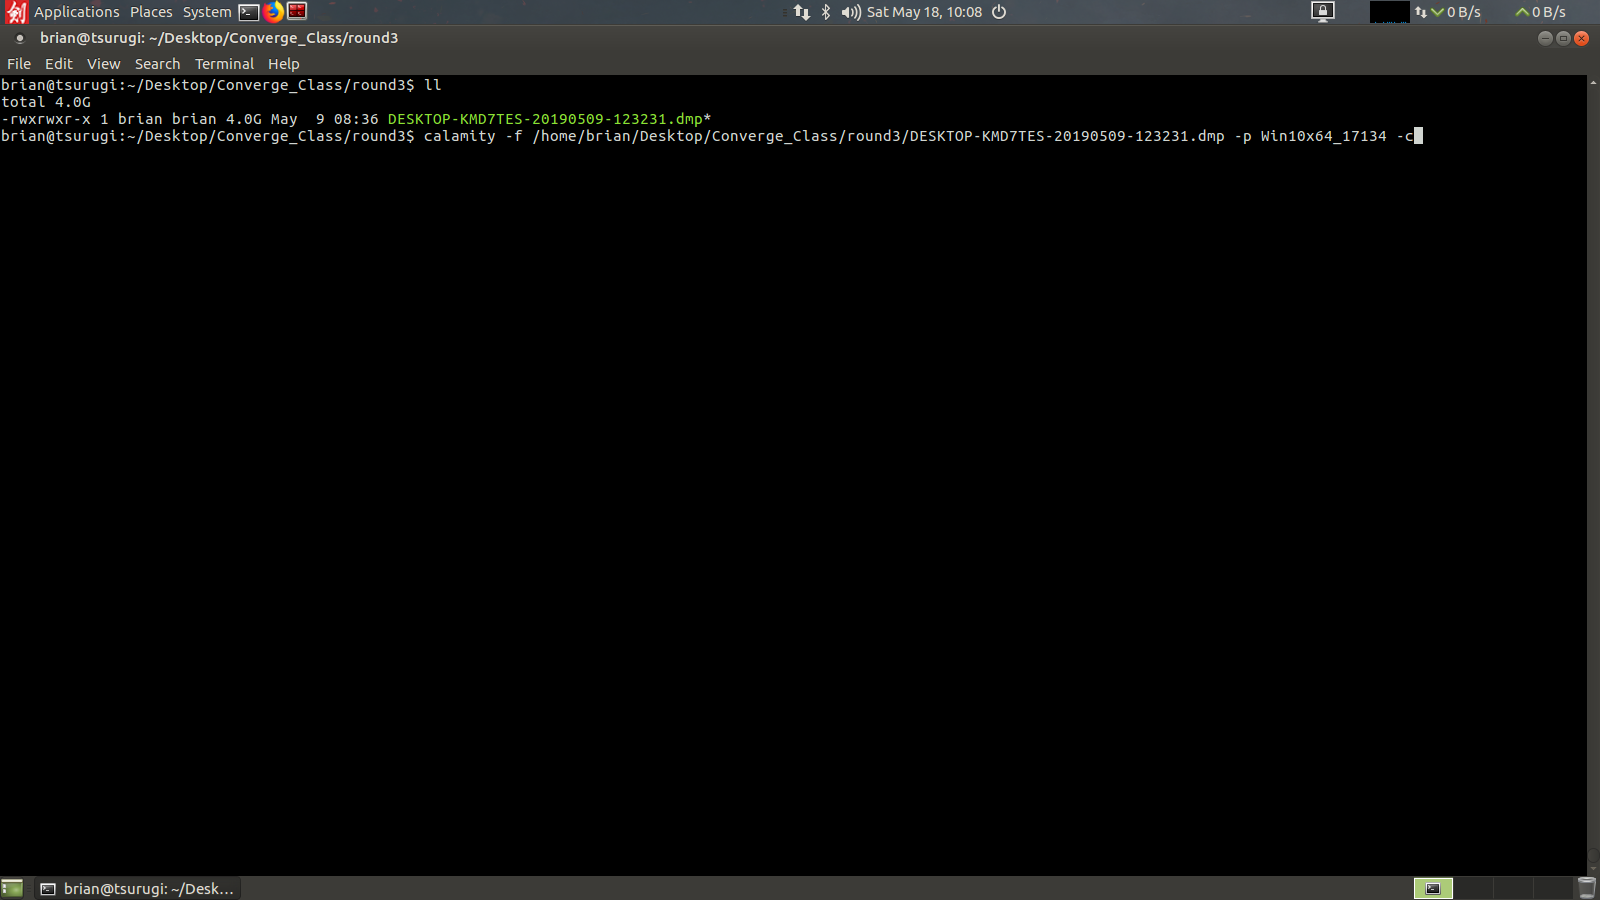
Now that we have gone through the guided analysis lets complete a fully automated analysis using Calamity. Here we will take a look at another memory sample from the workshop and try one of the automated analysis options. Here we will use the -f flag to give it the memory image to inspect (tab complete works in this mode), and -p for the profile to use (in this case you will already need to know the correct memory profile to use). The most common option I would recommend would be to use -q or –quickscan, but in this case I’d going to show you one other trick using -c which will check any malfind hits using the JPCERT Malconfscan Volatility plugin for malware configurations.
This will automatically complete the same analysis we did in the step by step before but without any additional input required from the analyst. We can see pslist, netscan, running, calamity also auto generates a case folder in the users home directory instead of prompting for one. Then malfind commences and ClamAV and Loki scans run.
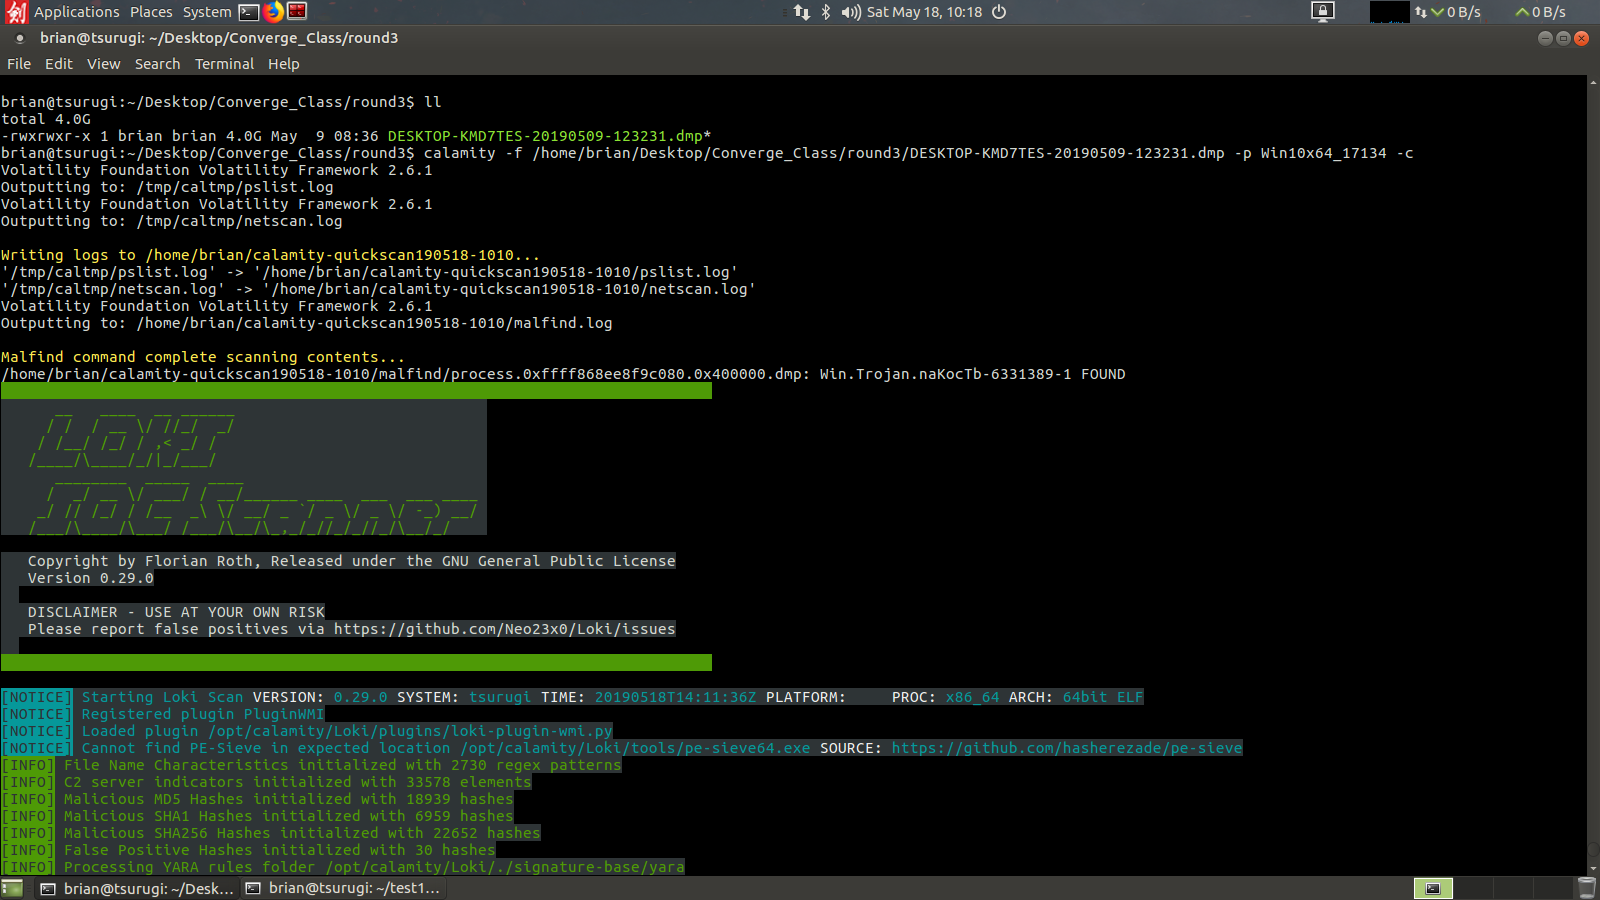 Here we have a ClamAV hit for what they call Trojan.naKocTb which maps to process 1812 under the ProformaInvoice executable.
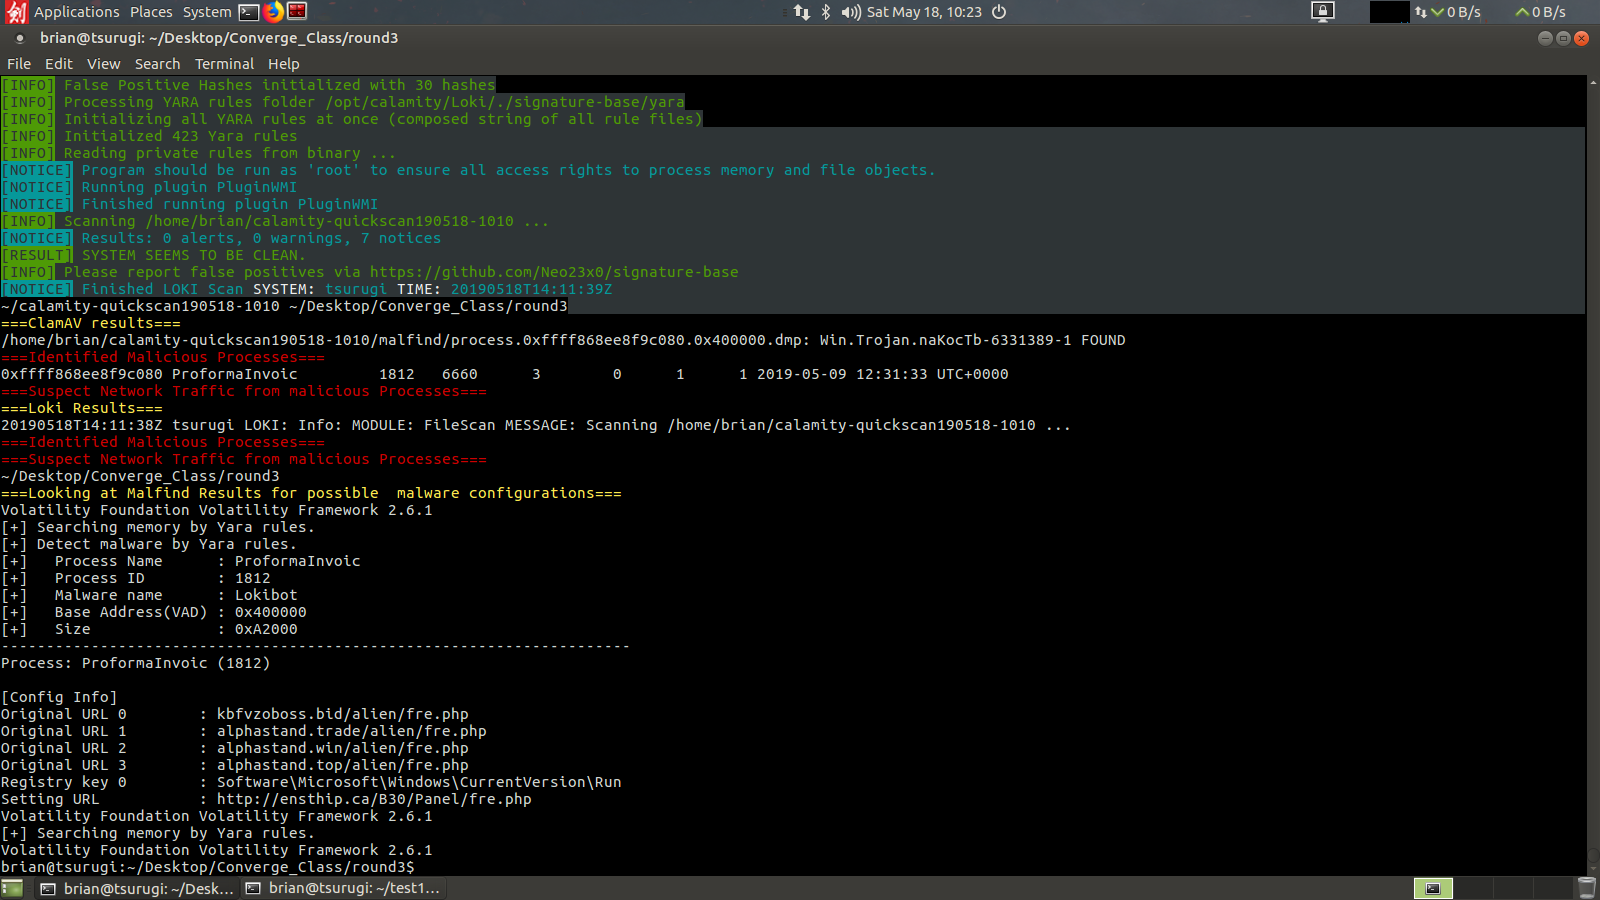
However after completing the correlation to processes and network connections Calamity runs a 2nd scan over the malfind results using the JPCERT malconfscan plugin which identifies a malware configuration for the Lokibot malware family and can pull from the running process its command and control Domains/URLs and here also can identify a Registry key persistence mechanism.
I hope that this tool can assist some SOC’s with another tool that they can employ and help those just getting started in DFIR the ability to get into memory forensics. If you want to go further into using Volatility I would highly recommend the Blackhat Asia talk given this year by Monnappa K A. In it he goes over many more malware samples and different techniques an analyst can employ pull pertinent data out of a memory dump.
If you have questions please feel free to message me on twitter @laskow26.